Endpoint Analysis Tool - Load Logs
In this section:
Having enabled logging and opened the Endpoint Analysis Tool, the configuration and associated log files need to be opened (or loaded) in the tool.
This section describes how to open the required files and summarizes key requirements. An example log file is used to illustrate particular features of the Endpoint Analysis Tool.
Opening Files
In practice, the console is not typically installed on the endpoint where logging has been enabled. In order to open and then analyze the log files either of the two possible approaches are recommended:
• Open the files on the endpoint using the hidden administrative shares.
For example, “\\endpointname\c$\ProgramData\AppSense\Environment Manager\logfilelocation"
•Set the log file location in the configuration to a convenient network share.
Note , this approach may be particularly well suited where multiple endpoints save to the same network share. The agent creates sub folders of the specified location, and the sub folder name contains the endpoint machine name.
Open the Configuration
The first step is to open the configuration file (.aemp file) to be analyzed.
To open the required configuration file:
• In the Endpoint Analysis Tool, from the File menu, select Open Configuration.
•Alternatively, press the following keyboard keys: Alt and F, then Alt and O.
The configuration is displayed:
There are some notable differences in the display and behavior of the configuration display in the Endpoint Analysis Tool compared with the console interface. Differences are summarized in the help section: Differences: Tool and Console Interface.
Open Endpoint Analysis Logs
Once the configuration has been loaded into the Endpoint Analysis Tool, the next step is to load one or associated log files (.etl files).
To open associated log files:
• In the Endpoint Analysis Tool, from the File menu, select Open Logs
Notes:
• Multiple .etl files may be selected.
• Each log file loaded must have events that match the configuration.
No events matching the loaded configuration found in loaded log files
If no relevant events are found in the selected file(s) a warning message is displayed and the file is not loaded.
No events were loaded from the selected log files
If selected files are empty a warning message is displayed and the file is not loaded.
A log file may empty because data has not yet been flushed to disk. In this case, wait a short time and then open the file again. Events should now be included.
•Additional files may be added by using the Open Logs function repeatedly.
•Files may be loaded from different endpoints that use the same configuration.
• Events from single sessions on a single endpoint may be highlighted by the Session Filter.
It is possible for a log file to contain events from more than one configuration. For example, where a new configuration has been deployed whilst events are being logged.
•The Endpoint Analysis Tool displays events that apply to the loaded configuration only - any other events in the log file are hidden.
To view events that apply to a different configuration, load that configuration first and then load the log file.
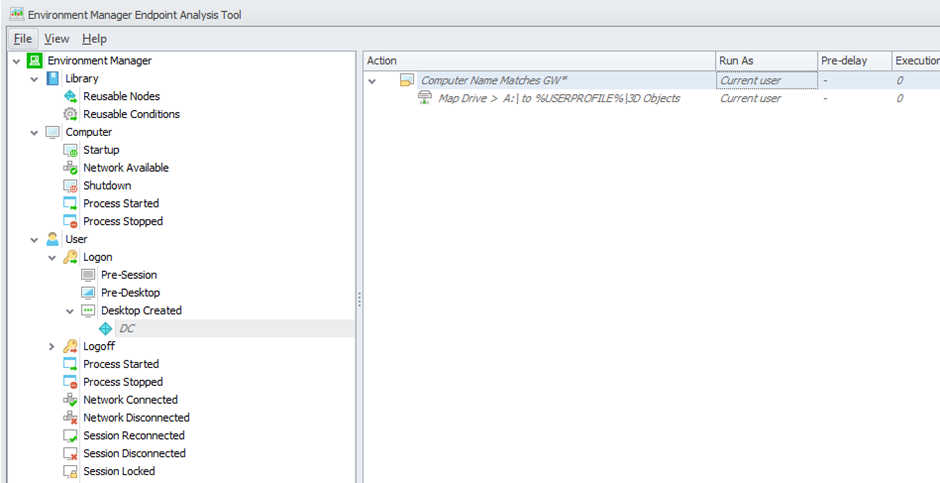
The log file is displayed.
For example:
Nodes that have been executed on the endpoint(s) are displayed using a normal font (in contrast, unexecuted nodes are shown in italics and a bold font indicates one or more child actions or conditions failed. Refer to Endpoint Analysis Tool - User Interface help topic. for further information about display conventions used.
In addition, statistics about the execution appear in the right-hand columns.
In the example illustrated above, the second condition succeeded, and the second action was executed (twice).
The Columns shown are:
| Column Heading | Description |
|---|---|
| Run As | The user being impersonated (from original configuration). |
| Pre-delay |
Pre-delay from original configuration. |
| Execution Count |
Number of times the action or condition was run. |
| Successes |
Number of times the action or condition ran without error. |
| Failures |
Number of times action or condition ran with error. |
| Condition Mismatches |
For conditions, the number of times the condition returned False. |
| Error Message |
Last error message on failure. |
For information about display conventions used in the Endpoint Analysis Tool, refer also to Endpoint Analysis Tool - User Interface help topic.
Related Topics:
Endpoint Analysis Tool - User Interface